
TomSolar feature · The story of solar PV in Britain
From one house to two million: the rise of solar in the UK
In 1994, a pioneering home in Nottinghamshire sent a little surplus electricity back through a meter that began to turn backwards. Three decades later, the UK is adding solar at a pace the pioneers could scarcely have imagined.

Solar has not become popular in a straight line. It arrived first as an expensive idea for people willing to experiment. Then a government tariff helped turn it into a recognisable home improvement. Costs fell, incentives changed, the market stumbled, and a new generation of solar-plus-battery systems began to answer a different question: how much of the power from my roof can I use myself?
Now the numbers are moving again. In 2025, the UK recorded 269,000 new solar installations, its highest annual total. By March 2026, the country had passed two million installations across homes, communities and solar farms. That is a remarkable journey from one small array and a backwards-spinning meter.
The day the meter turned backwards
The story begins at the Autonomous House in Southwell, Nottinghamshire. On 27 July 1994, a 2.16kWp solar array was connected to the local electricity network. Its 36 modules were rated at just 60 watts each. When the house was using less electricity than the panels were producing, the surplus flowed out to the grid.
Wind & Sun, which designed and supplied the system, describes it as the UK’s first domestic grid-connected PV installation. That is a useful, carefully bounded claim: it does not mean nobody in Britain had ever used a solar cell before, or that there had been no off-grid solar. It marks an early domestic system deliberately connected to the public network and exporting electricity.
The project could have been designed as a fully off-grid house, but storing enough electricity for reliable year-round use would have been difficult and expensive. Instead, the grid acted as a kind of shared buffer: the home used solar when it was available and imported electricity when it needed more. The first meter was a standard mechanical meter. When electricity flowed out, it went backwards.
In 1994, the array cost about £6,900 per kilowatt of capacity, according to a contemporary anniversary account. Its owners were proving a point, not chasing a quick return. The ingenuity was not only in the panels; it was in imagining a house as part of an energy system rather than just the endpoint of one.
Source: Wind & Sun’s account of the Autonomous House system.
What “first” means here: the first well-documented UK domestic PV system connected to the grid and exporting electricity. The history of solar research, solar thermal water heating and off-grid PV stretches further back.
From curiosity to a policy question
For years, solar PV remained a specialist technology. Panels were costly, a small roof array made relatively little power, and there was no broad national scheme paying households for what they generated. Early projects mattered because they showed that grid-connected solar could work in British conditions, but one demonstration did not yet make a mass market.
There is a data wrinkle in telling this part of the story. The government’s consistent monthly deployment series begins in January 2010. Earlier parliamentary answers often discussed installed capacity and noted that records of the number of individual installations were incomplete or difficult to assemble. So a chart that pretends to show a precise annual count from 1994 would give a false sense of certainty. The early years are best described through documented milestones and capacity snapshots; the reliable monthly count story starts later.
That distinction is useful, not disappointing. One array in 1994, a rapidly growing market after 2010, and a modern record year are three different kinds of evidence. Together they tell a more truthful story than a smooth line drawn through missing data.
The national capacity target: more than double
The first Southwell home system was 2.16kW. This comparison shows national capacity today against the 2030 ambition; it is not a chart of individual household installations. Sources: Climate Change Committee and UK Solar Roadmap.
The Feed-in Tariff changes the roof
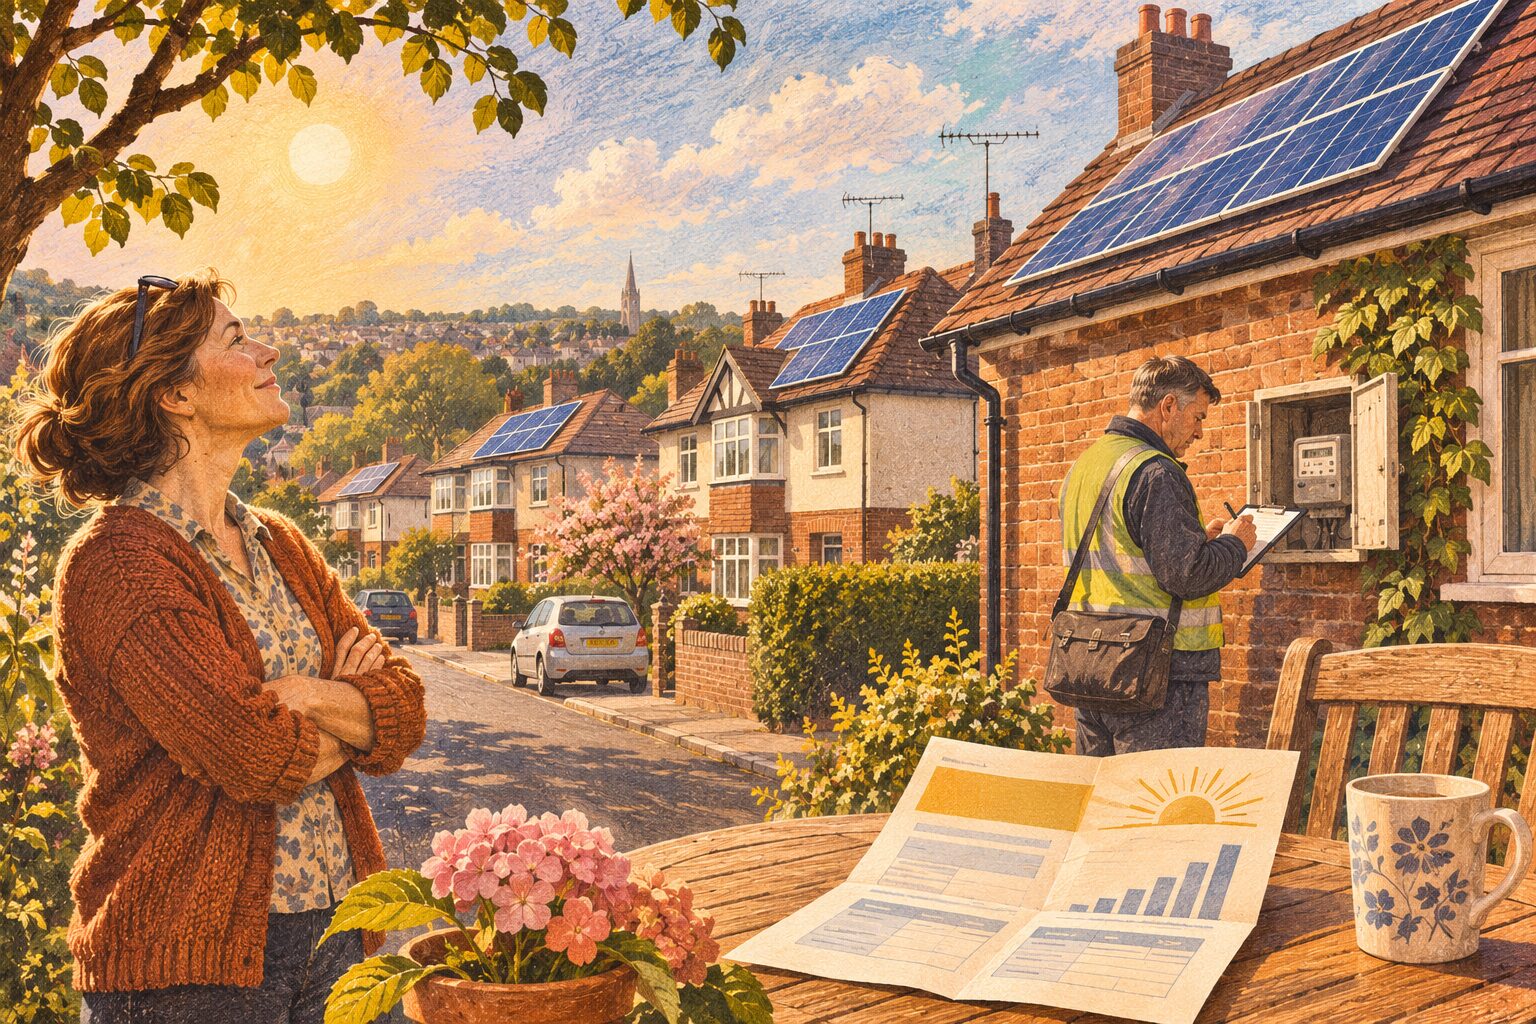
The big policy turning point came on 1 April 2010, when the Feed-in Tariff (FiT) scheme opened. For eligible small generators, the FiT paid for electricity generated and provided an export payment for electricity sent to the grid. Crucially, the owner did not need to use every unit at the moment it was generated to receive a generation payment.
That made the household calculation much easier to understand. A roof became a small power station with a predictable income stream attached. Installers, equipment suppliers and accreditation bodies expanded. Solar moved from the environmental enthusiast’s project into the mainstream home-improvement conversation.
Demand grew quickly, and the tariff rates were reduced as costs and deployment changed. Those changes could be abrupt and controversial: households raced to qualify before reductions, while the industry had to adapt to a faster-changing market. The lesson was lasting. Public policy can open a market at speed, but a tariff-led boom also makes the sector sensitive to the terms and timing of policy decisions.
A 2.16kWp domestic PV system at Southwell exports electricity to the local network.
Generation and export payments give small-scale solar a national financial framework.
Deployment accelerates, while tariff levels are adjusted as the scheme matures.
Existing accredited systems continue under their scheme terms, but new installations need another route to value their exports.
Suppliers offer export tariffs, with rates and contract terms set by each licensee.
Qualifying residential solar installations receive a zero VAT rate through 31 March 2027 under current legislation.
2025 sets a new annual installation record; the UK passes two million total installations in March 2026.
After the FiT: export becomes a choice
The FiT closed to new applicants on 1 April 2019. The next national framework was the Smart Export Guarantee (SEG), launched on 1 January 2020. Under the SEG, participating suppliers pay eligible small generators for exported electricity, using export-meter readings. Suppliers choose their own rates and terms, with the tariff required to be above zero.
This is a different deal from the FiT. There is no single guaranteed headline rate for every new installation, and the value of exported power depends on the chosen supplier and tariff. That makes the household’s pattern of use more important. A unit used at home avoids buying that unit from the supplier; a unit exported earns the export rate. The two values can be very different.
Smart tariffs have added another layer. Some households can combine solar with a battery and use lower-cost electricity at selected times, then draw from storage when grid power is more expensive. Export rates can also change through the day. The system is no longer just “panels earn money”; it is a home energy setup that can be planned around generation, consumption, storage and the tariff.
That is why a solar quote should explain its assumptions. How much generation is expected? How much is likely to be used in the home? What export tariff is assumed? Is a battery included, and what does it change? A payback figure without those answers is only a headline.
The hardware changed as much as the market
Those first Southwell modules produced 60 watts apiece. Modern domestic panels commonly deliver several hundred watts each, so a roof can now carry far more generating capacity than the pioneer array while using a modest number of modules. Panel efficiency, manufacturing scale and power electronics have all advanced.
Installations have also become easier to tailor. Multiple inverter trackers can help manage different roof faces; module-level electronics can be used where shade or roof layout makes them worthwhile; monitoring apps show what the system is producing. Most visibly, home batteries now let households store some daytime generation for the evening or shift grid electricity into a cheaper period. Hybrid inverters bring solar and storage together in one coordinated system.
A battery is not a magic box and it does not make every home independent of the grid. It adds cost, has limits, and should be sized around a household’s demand and tariff. But it changes the usefulness of solar for people who are out during the day, have an electric vehicle, or want more control over when they buy electricity.

Why the new surge is different
The UK did not simply pick up where the FiT left off. Costs continued to move down, households became more interested in energy bills and security, and the product proposition broadened from panels alone to solar with a battery, EV charging or other flexible use. Electricity prices have made that calculation more visible, though future prices are not guaranteed to rise in a straight line.
In 2025, the UK installed 269,000 solar systems, 37% more than in 2024. About 255,000 were rooftop systems on homes, businesses and other buildings. The government reported a new rooftop installation every two minutes on average throughout the year. In March 2026, the UK passed two million total solar installations. April 2026 then brought almost 23,000 more installations in a single month, with more than half on homes, according to the latest government announcement available when this guide was prepared.
These are installation counts, not a count of panels, household ownership or electricity produced. Nor do they mean that every installation was on a home: the total includes solar farms and other sites. Capacity tells another part of the story. The Climate Change Committee reported that 2.8GW of solar PV capacity was added in 2025, bringing UK capacity to 21.7GW at year-end.
The scale-up still has miles to go. The government’s Solar Roadmap sets a 2030 capacity range of 45–47GW. From 21.7GW at the end of 2025, reaching that range means adding roughly another 24–25GW in five years. The roadmap points to rooftops as an important part of the opportunity, alongside large solar farms.
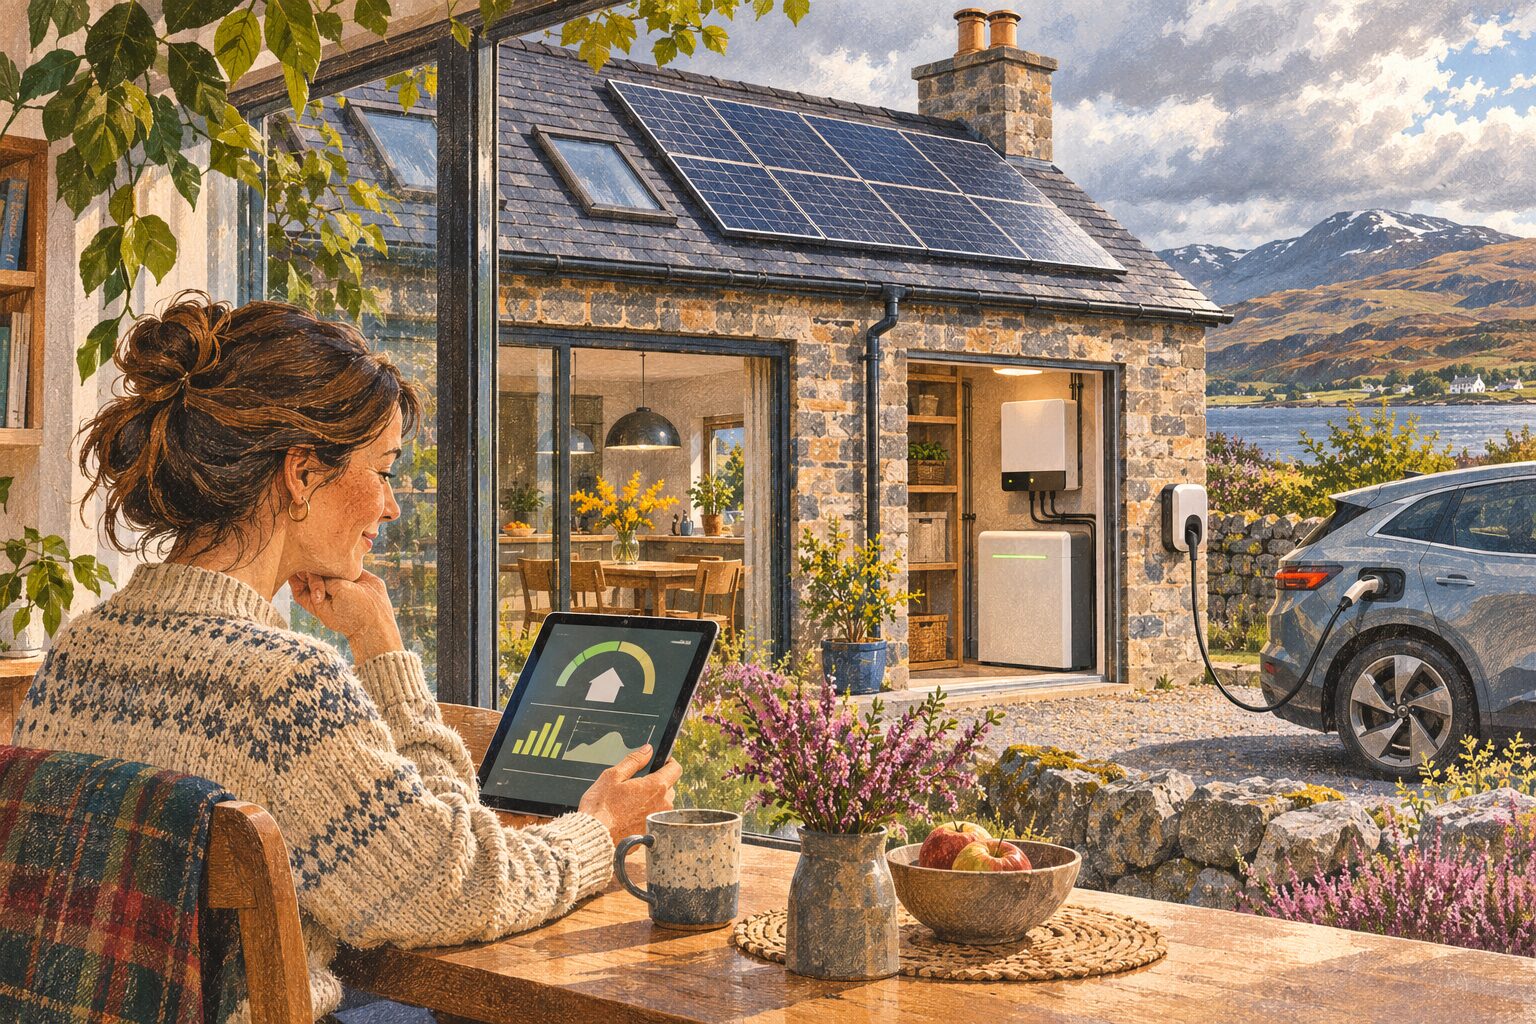
Not every roof. A solar-powered country.
Could every home in Britain end up with panels? It is an exciting picture, but no single technology will suit every building. Some roofs are shaded, unsuitable or constrained; some homes are flats; and some households will benefit more from shared or nearby generation. A resilient energy system needs more than one answer.
But the direction is unmistakable. Solar has moved from a pioneering 2.16kW array to millions of installations, a record year, and a national target more than double today’s capacity. On suitable roofs, panels are becoming a practical part of how a home buys and uses electricity. New homes, public buildings, workplaces, car parks and communities can all add to the mix.
The celebration is not that every roof must look the same. It is that the choice to generate clean electricity where it is used is becoming ordinary—and that the grid of the future can be built around millions of homes taking part.
Questions about the UK solar story
When was the first domestic solar PV installation in the UK?
The first well-documented domestic grid-connected PV system that exported electricity to the grid was commissioned at the Autonomous House in Southwell on 27 July 1994. Earlier solar research and off-grid uses existed.
How many solar installations were there in the UK in 2025?
DESNZ reported 269,000 installations in 2025, including about 255,000 rooftop installations. The UK passed two million total installations in March 2026.
Can we chart installations all the way back to 1994?
Not as a continuous, like-for-like annual count from the available official series. DESNZ’s monthly deployment dataset begins in January 2010. Earlier records are more useful for documenting key projects and capacity milestones than exact annual installation totals.
Sources and data notes
This guide separates installation counts, installed capacity and electricity generation because they measure different things. The opening history uses a company account from the installer of the 1994 system; national deployment and policy claims are linked to government, Ofgem and independent public bodies.
- Wind & Sun: the UK’s first domestic grid-connected PV system — system size, date and design details.
- DESNZ Solar PV deployment dataset — monthly UK deployment series, January 2010 onward; updated through August 2026 at the time of writing.
- DESNZ, 28 May 2026 — 2025 record, rooftop share, 2 million milestone and April 2026 update.
- Climate Change Committee, 2026 progress report — 2025 capacity addition and end-year installed capacity.
- Ofgem: Feed-in Tariffs — introduction and purpose of the FiT.
- Ofgem: FiT scheme closure and current options — closure date and SEG launch.
- Ofgem: Smart Export Guarantee — eligibility and how export payments work.
- UK Solar Roadmap — 45–47GW 2030 capacity range and deployment actions.
- VAT legislation for energy-saving materials — temporary zero rate in Great Britain through 31 March 2027 under current law.
Thinking about solar for your own roof? The national story is useful context, but the right system depends on your roof, electricity use, battery plans and export tariff.
Check your roof with Tom Solar